Dashboard
Your account home: equity, profit-target progress, cushion to breach, and recent trades, across every account you hold.
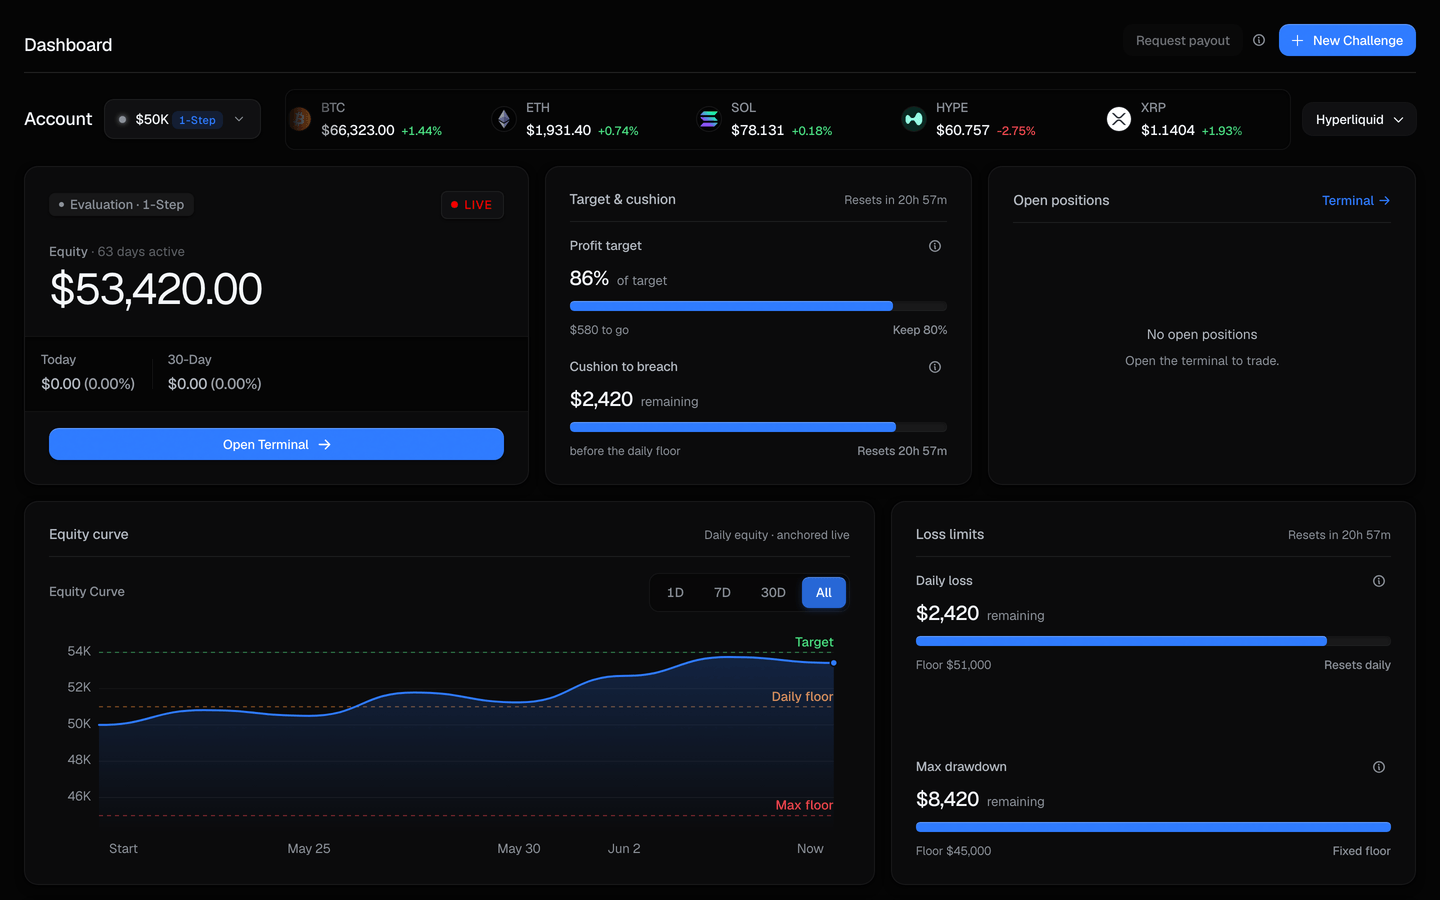
The Dashboard is your account home. It shows your equity, how close you are to the profit target, how much room you have before a breach, and your recent trades, across every account you hold. It is your private view: anything you share publicly uses a percentages-only boundary, never your balance or position sizes.
For the exact numbers behind the meters, the Dashboard links to the Rules; this page explains what each panel shows.
The account switcher
During beta you hold 1 paid challenge account at a time, and a free trial can sit alongside it. The switcher lists every account you hold, and selecting one focuses the rest of the Dashboard on that account.
| Element | What it shows |
|---|---|
| Account chip | One per account, with its size, phase (Arena · 1-Step, Gauntlet · 1-Step, Hyper · 1-Step, and Arena · 2-Step, or Funded), and status. |
| Selection | The selected account drives the cockpit, meters, and activity below. |
The portfolio strip
A summary across all of your accounts, above the per-account detail.
| Field | What it shows |
|---|---|
| Equity | Your combined equity across accounts. |
| Today's P&L | Your profit or loss so far today. |
| Total P&L | Your cumulative profit or loss. |
| Payoutable | Your withdrawable profit share, totalled across your funded accounts. Enabled when you have a funded account with a withdrawable balance. A payout itself draws from one account at a time - see Payouts. |
The cockpit
The main panel shows the selected account in detail: its equity, its status badge and phase, days active, and total P&L with the percentage.
The equity curve
An area chart of your equity over time, with time-range tabs (1D, 7D, 30D, and All) and reference lines marking your loss floors, so you can see your path relative to the limits.
Profit-target progress
A bar showing how far you are toward your account's profit target, the amount remaining, and, once funded, your 80% profit split. The target for each evaluation type is on the How it works page.
The loss-limit meters
Two meters show how much equity you can lose before you touch a floor: your cushion to the daily-loss floor (with a countdown to its reset) and your cushion to the maximum-drawdown floor. They shift from blue to amber to red as the cushion shrinks, so risk building is visible before it becomes a breach.
How the floors are measured
The meters show your cushion; exactly how equity is measured, what counts toward a breach, and when the daily floor resets are defined in Equity-based limits in the Rules, and explained in Trading rules.
Recent activity
Below the cockpit, a trade journal lists your most recent closed trades with market, side, size, entry and exit price, and net P&L. Each row has a Share control that opens a privacy-safe PnL card.
Your private view
The Dashboard shows your real figures to you. Anything you share, the leaderboard, and public trader profiles use a percentages-only boundary, so your balance and position sizes stay private.
Related
- How it works - the evaluation types and their profit targets.
- Payouts - withdraw your profit share once funded.
- The Rules - the authoritative limits behind the meters.